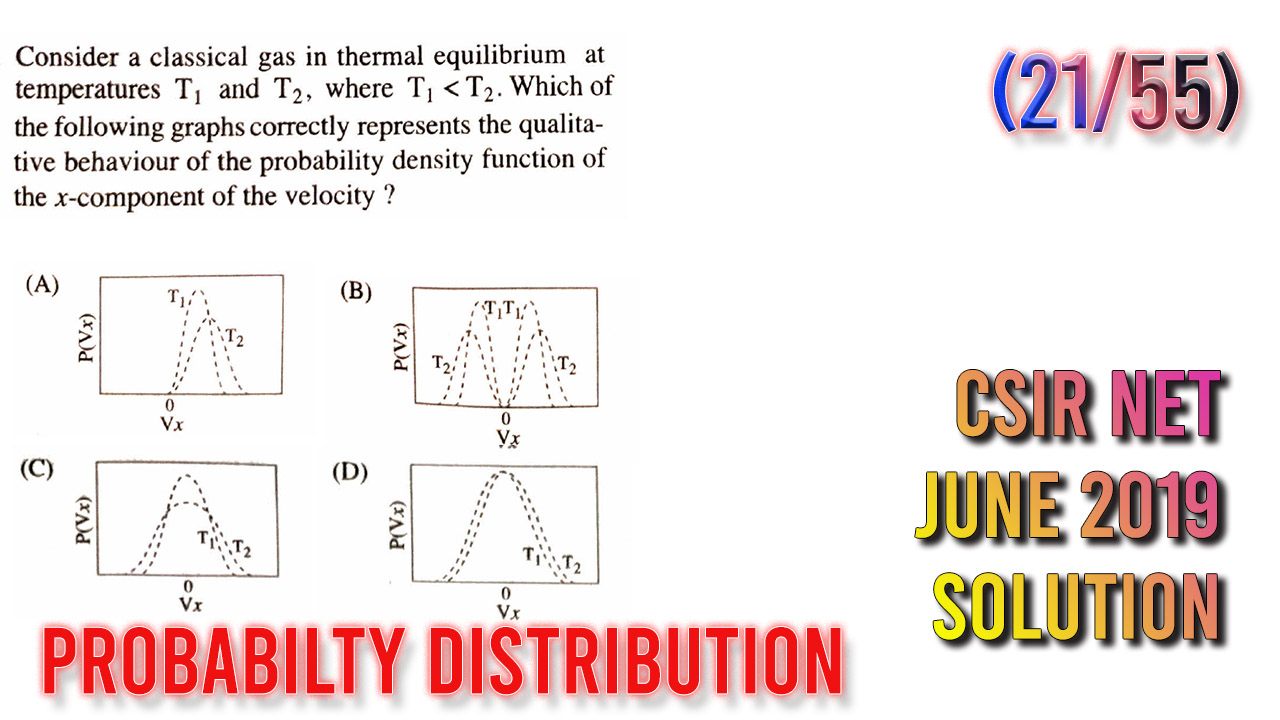
The question goes like this:
Classical gas in thermal equilibrium at temperature T1 and T2. T1 < T2 which of the following graphs correctly represent the qualitative behaviour of the probability density function of the X component of the velocity.

Solution is below
The Slide PDF can be found here :
Subscribe us 👇
Visit our parent website for more resources & Mock tests 👇
🔥🔥FREE Mock Test:👉https://bkacademy.in/physicsplus/
🔆PDF link:👉https://physicsplus.science.blog/
🔆Our Socials
👉https://indiaphysics.quora.com/
👉https://www.facebook.com/IndiaPhysics/
👉https://www.instagram.com/indiaphysics/
👉https://twitter.com/india_physics
🔆Our Groups
